Phase changes describe points boundaries in a time series or spatial data where there is markedly different type of behaviour either side. or example, stock markets are often descibed as being in a Bull market (prices generally rising, albeit with day-to-day variability) or a Bear market (prices generally faling, albeit with day-to-day variability). Typically one needs a different stochastic model for the different phases, and, ideally but more difficult, models of when phase changes occur.
Used in Chap. 14: page 205
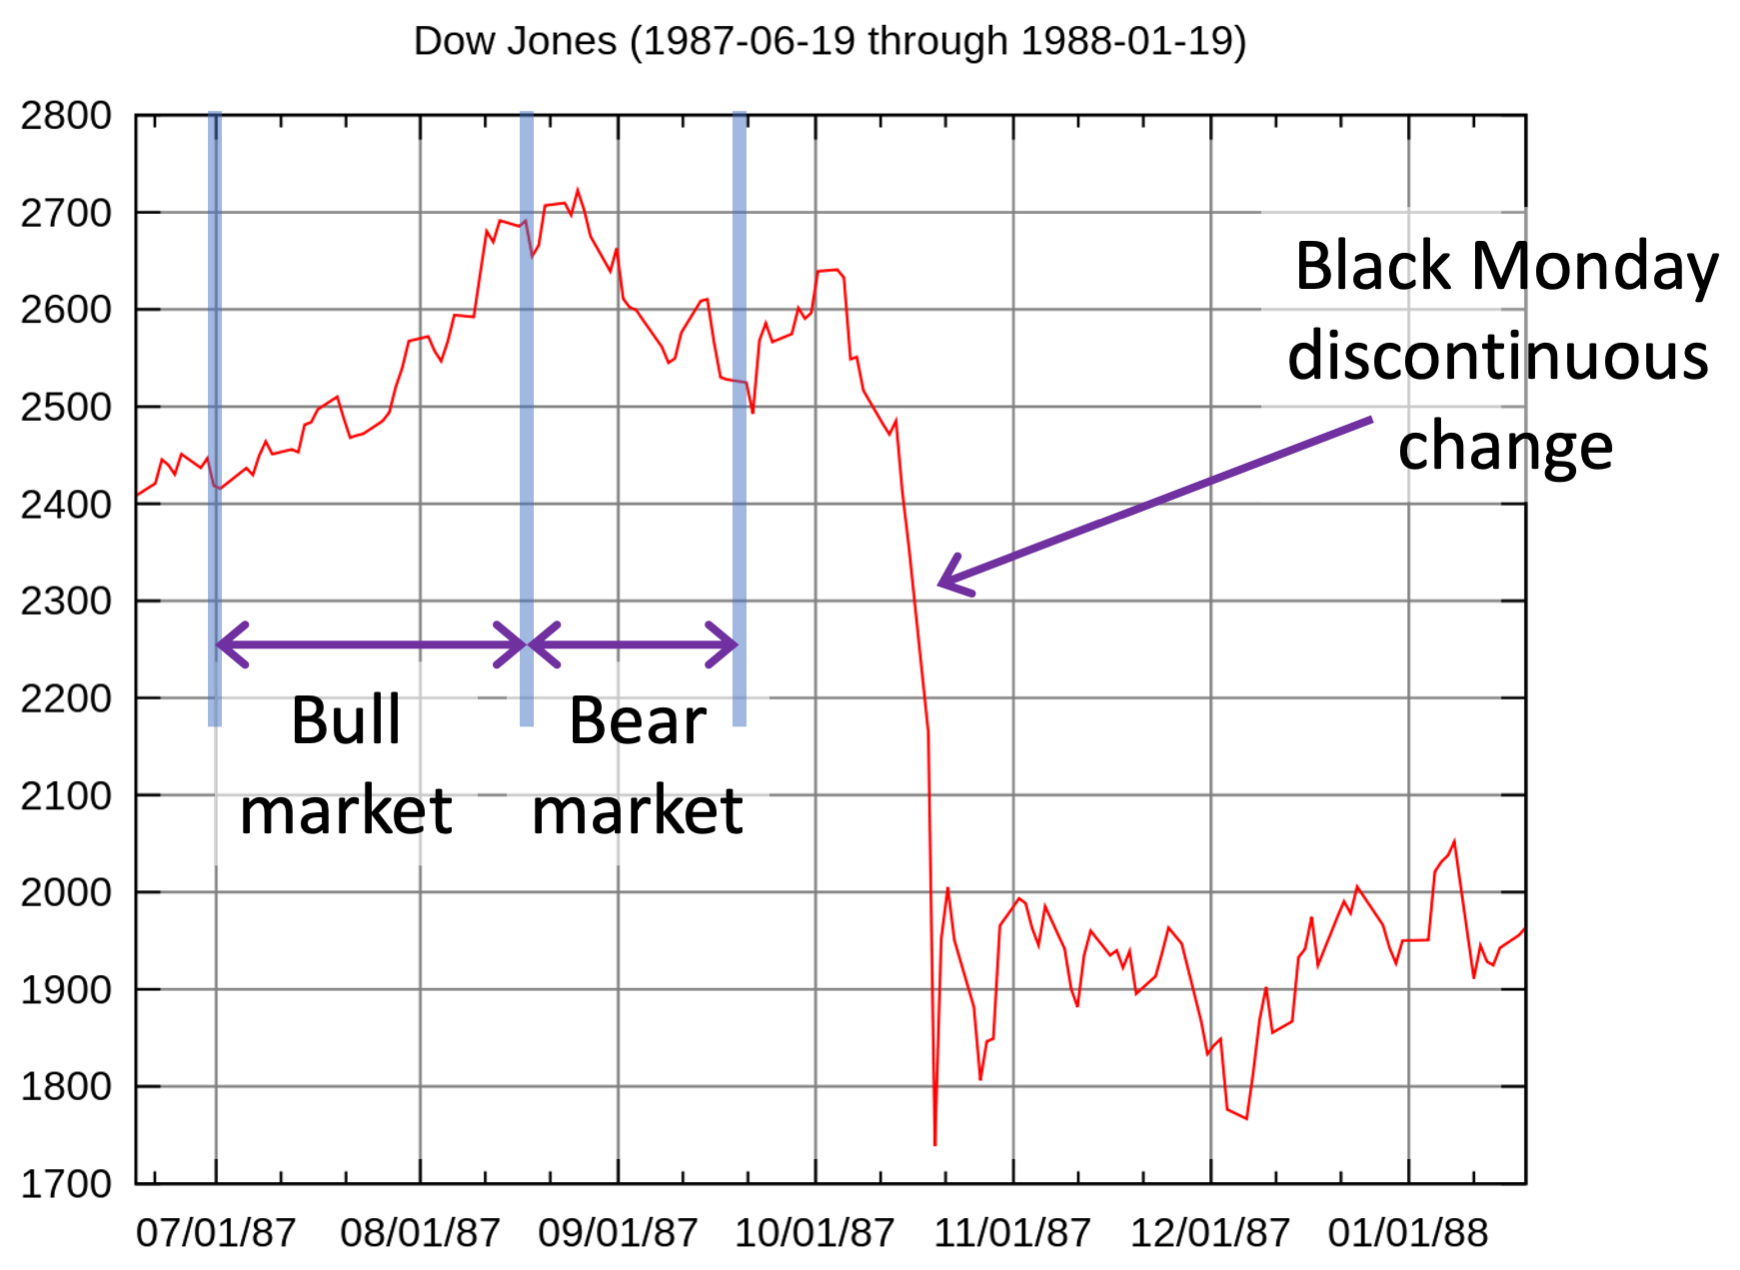
Stock market leading up to and after Black Monday, 19th October 1987 – note esepcially the phase change bdetween Bull and Bear markets (Source: Wikimedia).